

pyglotaran#


A framework written in Python for global and target analysis; commonly used for the analysis of time-resolved spectroscopy measurements in the study of energy transfer pathways in photosynthesis, or the characterization of energy transfer (in-)efficiencies in photovoltaics.
Note: Install a stable release of pyglotaran from PyPI, e.g. with uv pip install pyglotaran (see the installation guide). The main branch of this repository is used for development and may be unstable; installing or using pyglotaran directly from the repository is at your own risk.
The Future of Global and Target Analysis#
A scientific publication titled “pyglotaran: a lego-like Python framework for global and target analysis of time-resolved spectra” (DOI: 10.1007/s43630-023-00460-y) covers aspects of the architecture and the design of the software while illustrating its flexibility as an analysis tool through some exciting case studies. This publication, along with other pyglotaran-publications demonstrates why we believe this framework is the future of global and target analysis.
Usage of pyglotaran#
If you just want to get started analyzing your data, jump straight to the getting started guide that is part of our documentation.
Afterwards, you may also want to have a look at our comprehensive collection of real-world examples in the pyglotaran-examples repository. There most like is an example that aligns well with your use case.
For state of the art usage of this framework you may want to check out the list of pyglotaran-publications.
Example analysis results#
Results of a target analysis of Photosystem I (see study_florescence in the examples.)
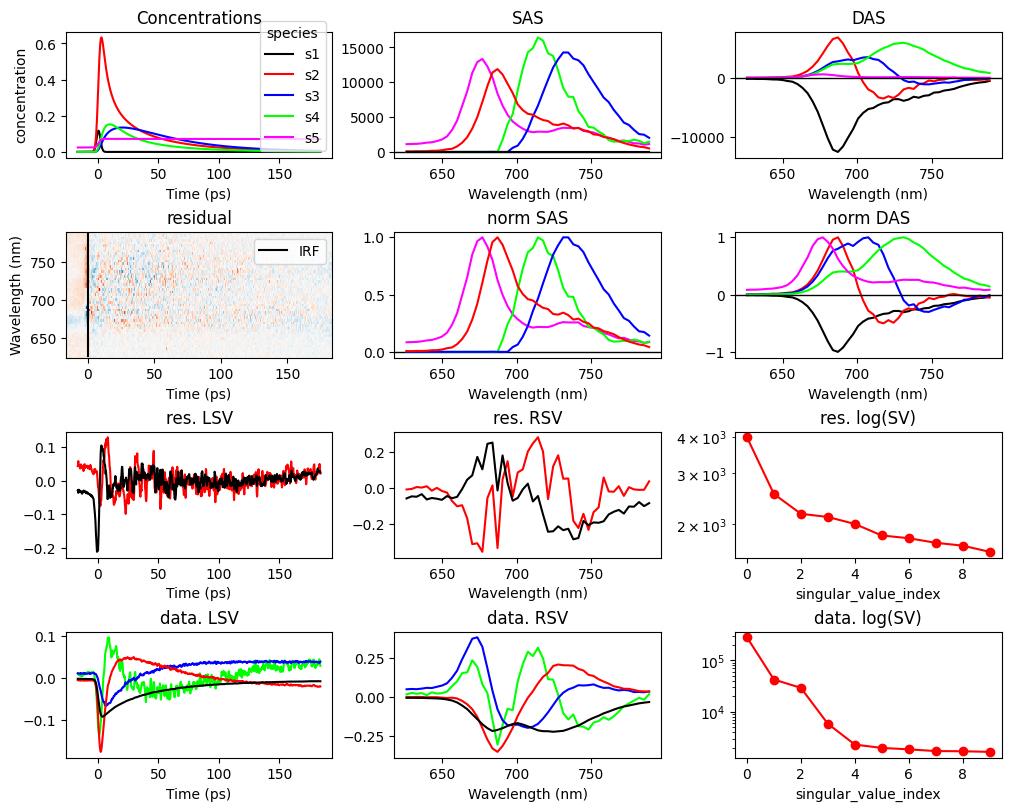 Plot created with the
plot_overview function of the pyglotaran-extras package.
Notice: This is (still) an early access release, please refer to the usage notice prior to committing to use pyglotaran to avoid surprises down the line.
Glotaran legacy#
The pyglotaran package derives its name from the Glotaran software package (now called glotaran-legacy), first released in 2011 and described in a highly-cited publication in the Journal of Statistical Software, under the title Glotaran: A Java-Based Graphical User Interface for the R Package TIMP (DOI: 10.18637/jss.v049.i03).
The pyglotaran framework can be considered the spiritual successor of the glotaran-legacy software and has the backing of many of its original creators.
Community Support#
For questions / suggestion please reach out to us via:
Credits#
The credits can be found in the documentation authors section
Introduction#
Pyglotaran is a python library for global analysis of time-resolved spectroscopy data. It is designed to provide a state of the art modeling toolbox to researchers, in a user-friendly manner.
Its features are:
user-friendly modeling with a custom YAML (
*.yml) based modeling languageparameter optimization using variable projection and non-negative least-squares algorithms
easy to extend modeling framework
battle-hardened model and algorithms for fluorescence dynamics
build upon and fully integrated in the standard Python science stack (NumPy, SciPy, Jupyter)
A Note To Glotaran Users#
Although closely related and developed in the same lab, pyglotaran is not a replacement for Glotaran - A GUI For TIMP. Pyglotaran only aims to provide the modeling and optimization framework and algorithms. It is of course possible to develop a new GUI which leverages the power of pyglotaran (contributions welcome).
The current ‘user-interface’ for pyglotaran is Jupyter Notebook. It is designed to seamlessly integrate in this environment and be compatible with all major visualization and data analysis tools in the scientific python environment.
If you are a non-technical user, you should give these tools a try, there are numerous tutorials how to use them. You don’t need to really learn to program. If you can use e.g. Matlab or Mathematica, you can use Jupyter and Python.
Table of Contents: